
MyLens: Communicate Complex Topics and Generate Visual Guides

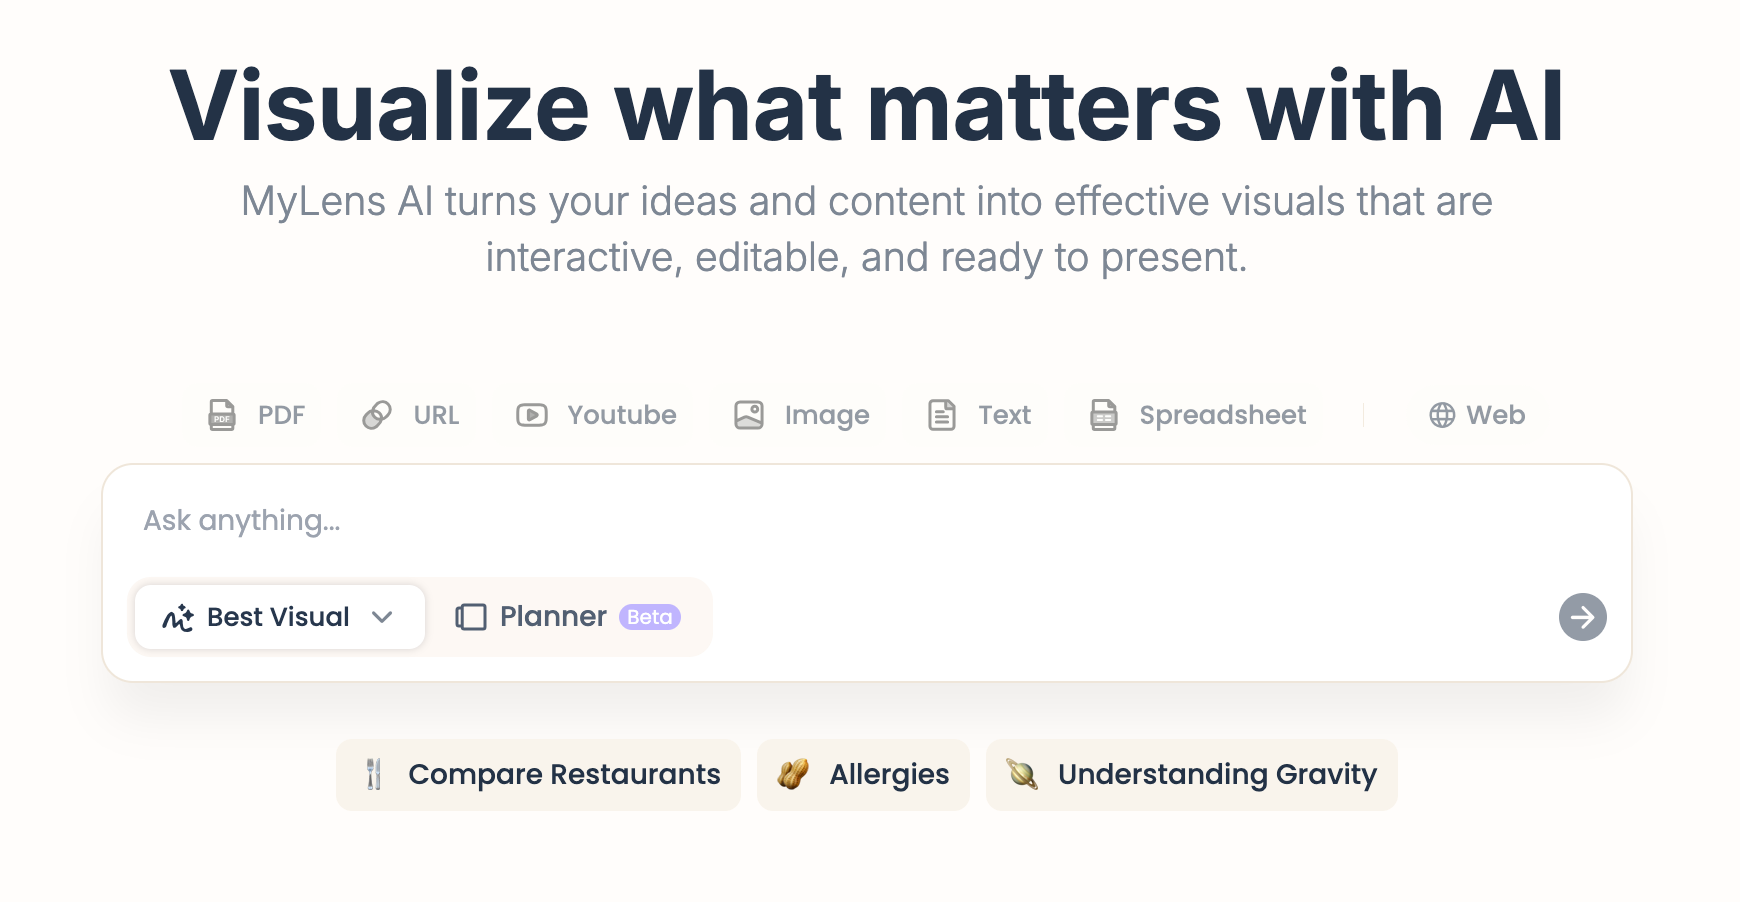
AI has made great strides in generating infographics, and MyLens makes visualizing complex ideas and sources fast and easy. MyLens uses AI to turn your texts and content into interactive visuals, such as mind maps, timelines, flowcharts, tables, and charts. MyLens helps you “visualize what matters” from any source, quickly, and in a form that’s editable and shareable.
MyLens has a dedicated page for teachers, discussing lesson prep, study guides, handouts, e-learning, and collaborative PD use. MyLens for Educators can help teachers communicate complex topics clearly by extracting key points and choosing an effective visual format (mind map, timeline, flowchart, table, etc.). MyLens can also help students learn by turning dense materials into visual study guides, focused on “what matters most.”
[As you may know, I am a fan of Napkin and use it regularly to generate infographics for tomdaccord.com. But MyLens provides more visual diversity and so more teaching and learning possibilities. And, Napkin is no longer completely free.]
How it works
With MyLens, you simply drop in a source — text, PDFs, videos, webpages, spreadsheets, or even a prompt — and it instantly turns the source into a clear, editable visual. (Data is not used for model training; only to create your visual.)
You can choose the visual you want or let the AI select an appropriate visual structure. There are several visual types available:
Timeline: Visualize events or milestones in chronological order.
Mindmap: Break down ideas into clear, visual branches.
Table: Organize structured data for quick, easy insights.
Board: Use minimal cards to organize insights on any topic neatly.
Flowchart: Map out steps and decisions logically and visually.
Quadrant: Compare items across two axes in four boxes.
Bar Chart: Display and compare categorical data effectively.
Line Chart: Track trends and patterns over time.
Donut Chart: Showcase proportions in a clean, visual format.
So, you can pick a visual that matches your objective. For example:
processes → flowcharts
sequences → timelines
networks/definitions → mind maps.
In partnership with Graded Pro

Graded Pro is a robust platform that has evolved from a smart Google Classroom add-on into a full-service AI grading ecosystem now used by over 1,000 schools worldwide.
Graded Pro effortlessly handles essays and extended writing, mathematical proofs, science reports, art portfolios, and even messy pen-and-paper work and sketchbook pages. COPPA, FERPA compliant.
With Graded Pro, teachers can grade work up to 95% faster, freeing hours each week for student coaching and individual support.
Global curriculum frameworks come pre-loaded with U.S. Common Core, AP, IB, UK GCSE, and A-Level. Custom rubrics are just a copy‑and‑paste away.

To see MyLens in action, check out MyLens’s one-minute demo video or this YouTube tutorial for teachers.
Special Features
You can “drill down” or “expand” by clicking. This is one of my favorite features. You can go more in-depth on a topic simply by clicking or hovering on it in a visual. It’s a way of encouraging interactive exploration and growing parts of a visual.
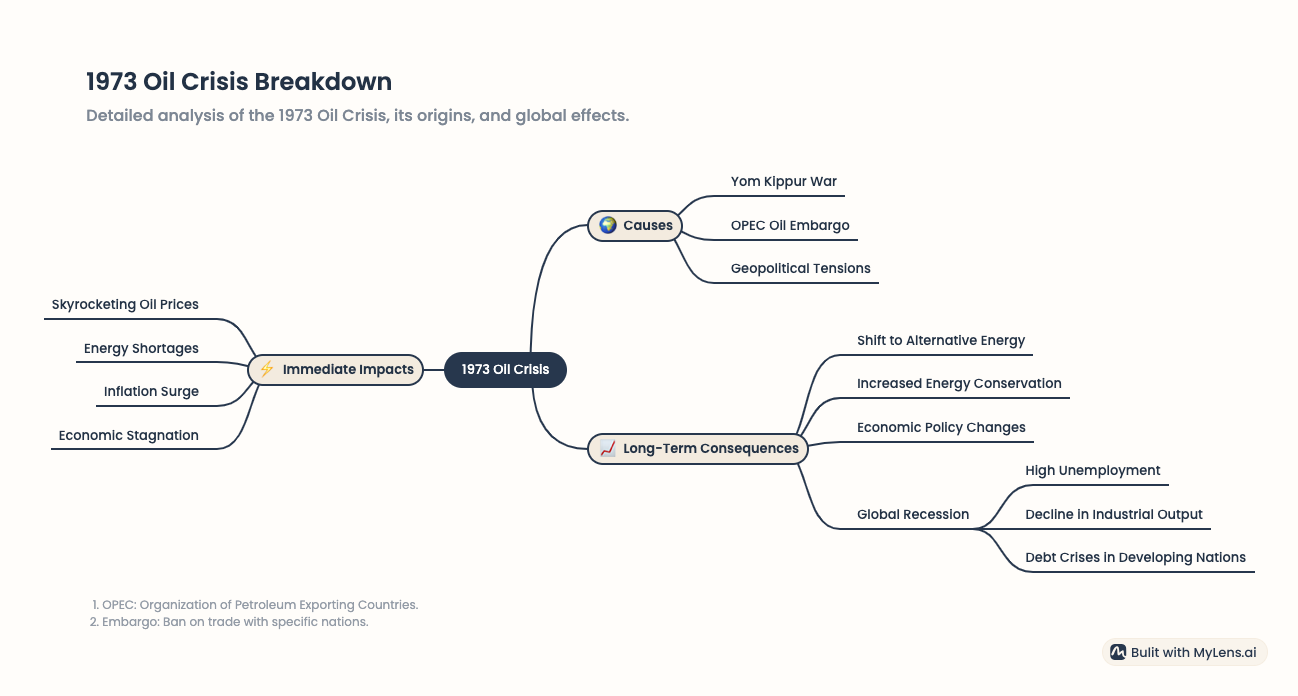
For instance, as shown in example 2 below, I can click on the 1973 “Oil Crisis” listed in the Major World Economic Crisis visual to learn more about the crisis.
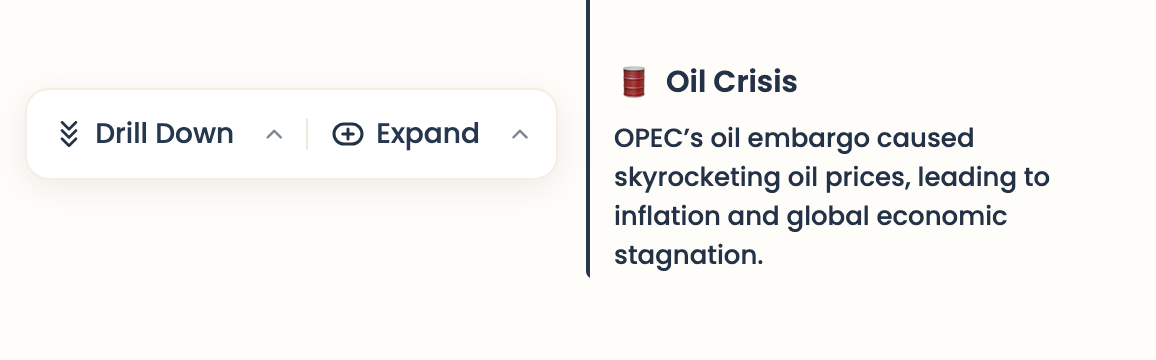
Drill Down narrows the focus by taking selected node (in my example, “Oil Crisis”) and opens a dedicated, more detailed view of just that topic.
Expand grows outward in place. It keeps the current visual intact but adds new, related branches or details connected to the selected node.
Your can also break visuals into parts. The new beta Planner mode breaks your topic into key parts. It creates a connected series of visuals, each focused on a single key detail, and you add, remove, or edit steps. Watch this YouTube video for a demonstration.
You can present, share, or download. You can present directly in MyLens or embed/share links. (Free plan stories are public and discoverable online.) You can also download a PNG version for slides, an LMS, handouts, etc.
You can view public “stories.” You can also browse examples others have made, such as Here are a few education-oriented stories, Key Learning Concepts, Biomolecules and Their Categories, Atomic Structure Overview, World War II Overview, and Evolución del Arte Visual.
Classroom ideas
Below, I show a few concrete ways to use MyLens for teaching and learning:
1) Make concepts visible (mind maps)
I asked MyLens to construct a mind map of ecosystems (energy flow, trophic levels, cycles). More specifically, my prompt was:
Construct a mind map of ecosystems (energy flow, trophic levels, cycles) appropriate for a middle school classroom lesson.
Here is what it produced:
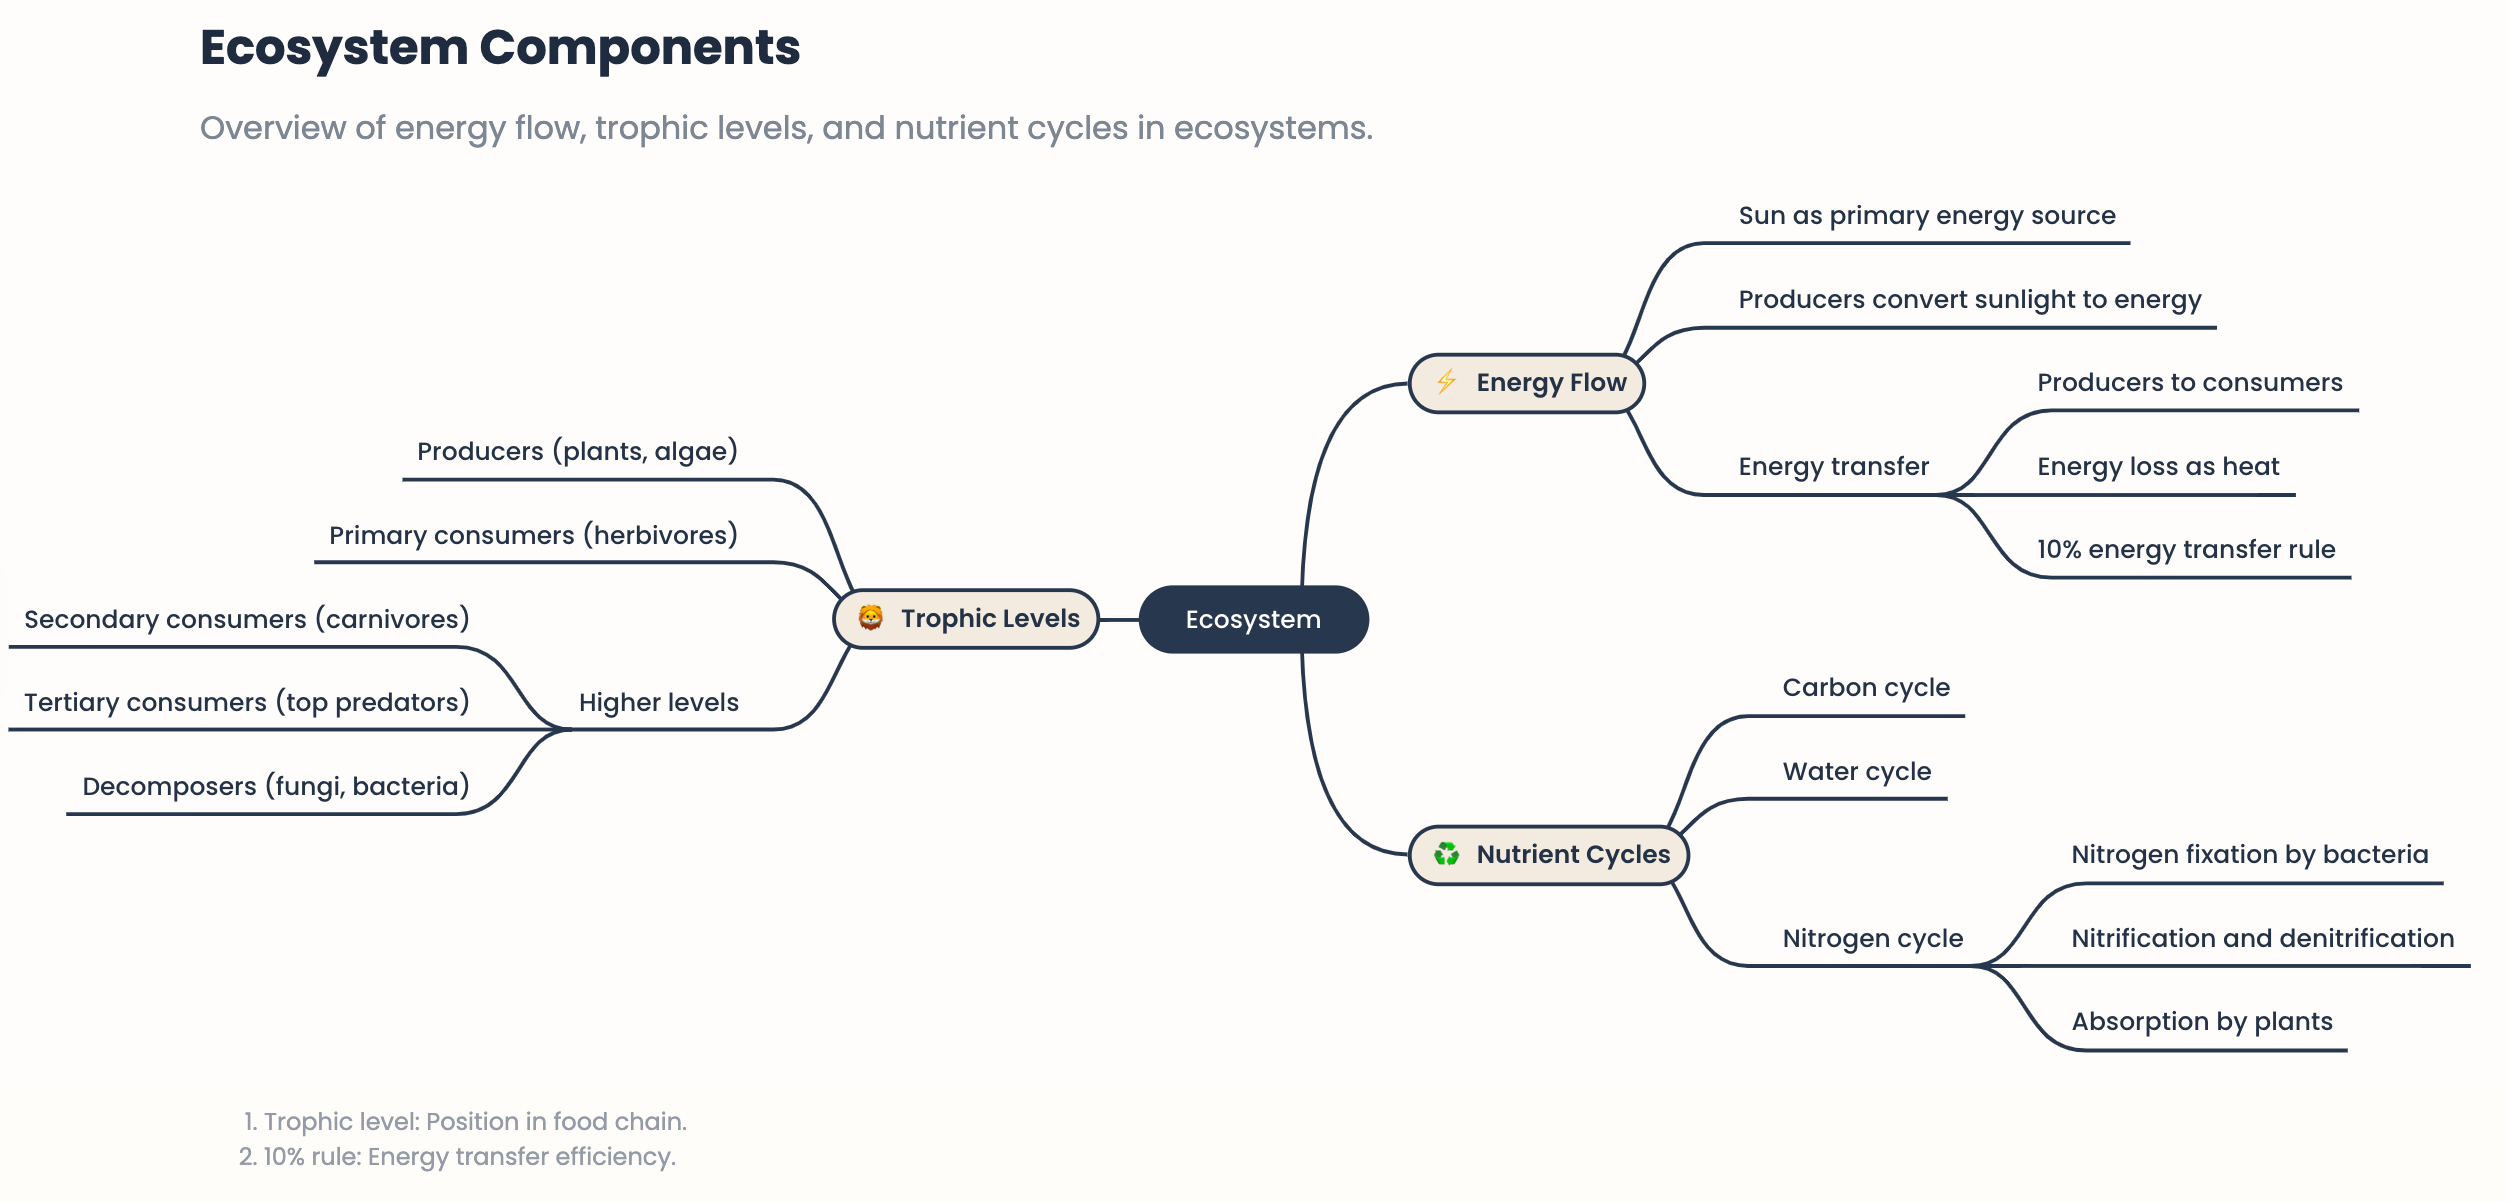
MyLens’s mind map app is tailored to organize key concepts, and does just that in this example.
2) Clarify chronology and causation (timelines)
I asked MyLens to build a timeline of major economic crises with causes, policy responses, and outcomes. My prompt was:
Build a timeline of major world economic crises — with causes, policy responses, and outcomes — appropriate for an upper-level high school economics course.
Here is (part) of what it produced:
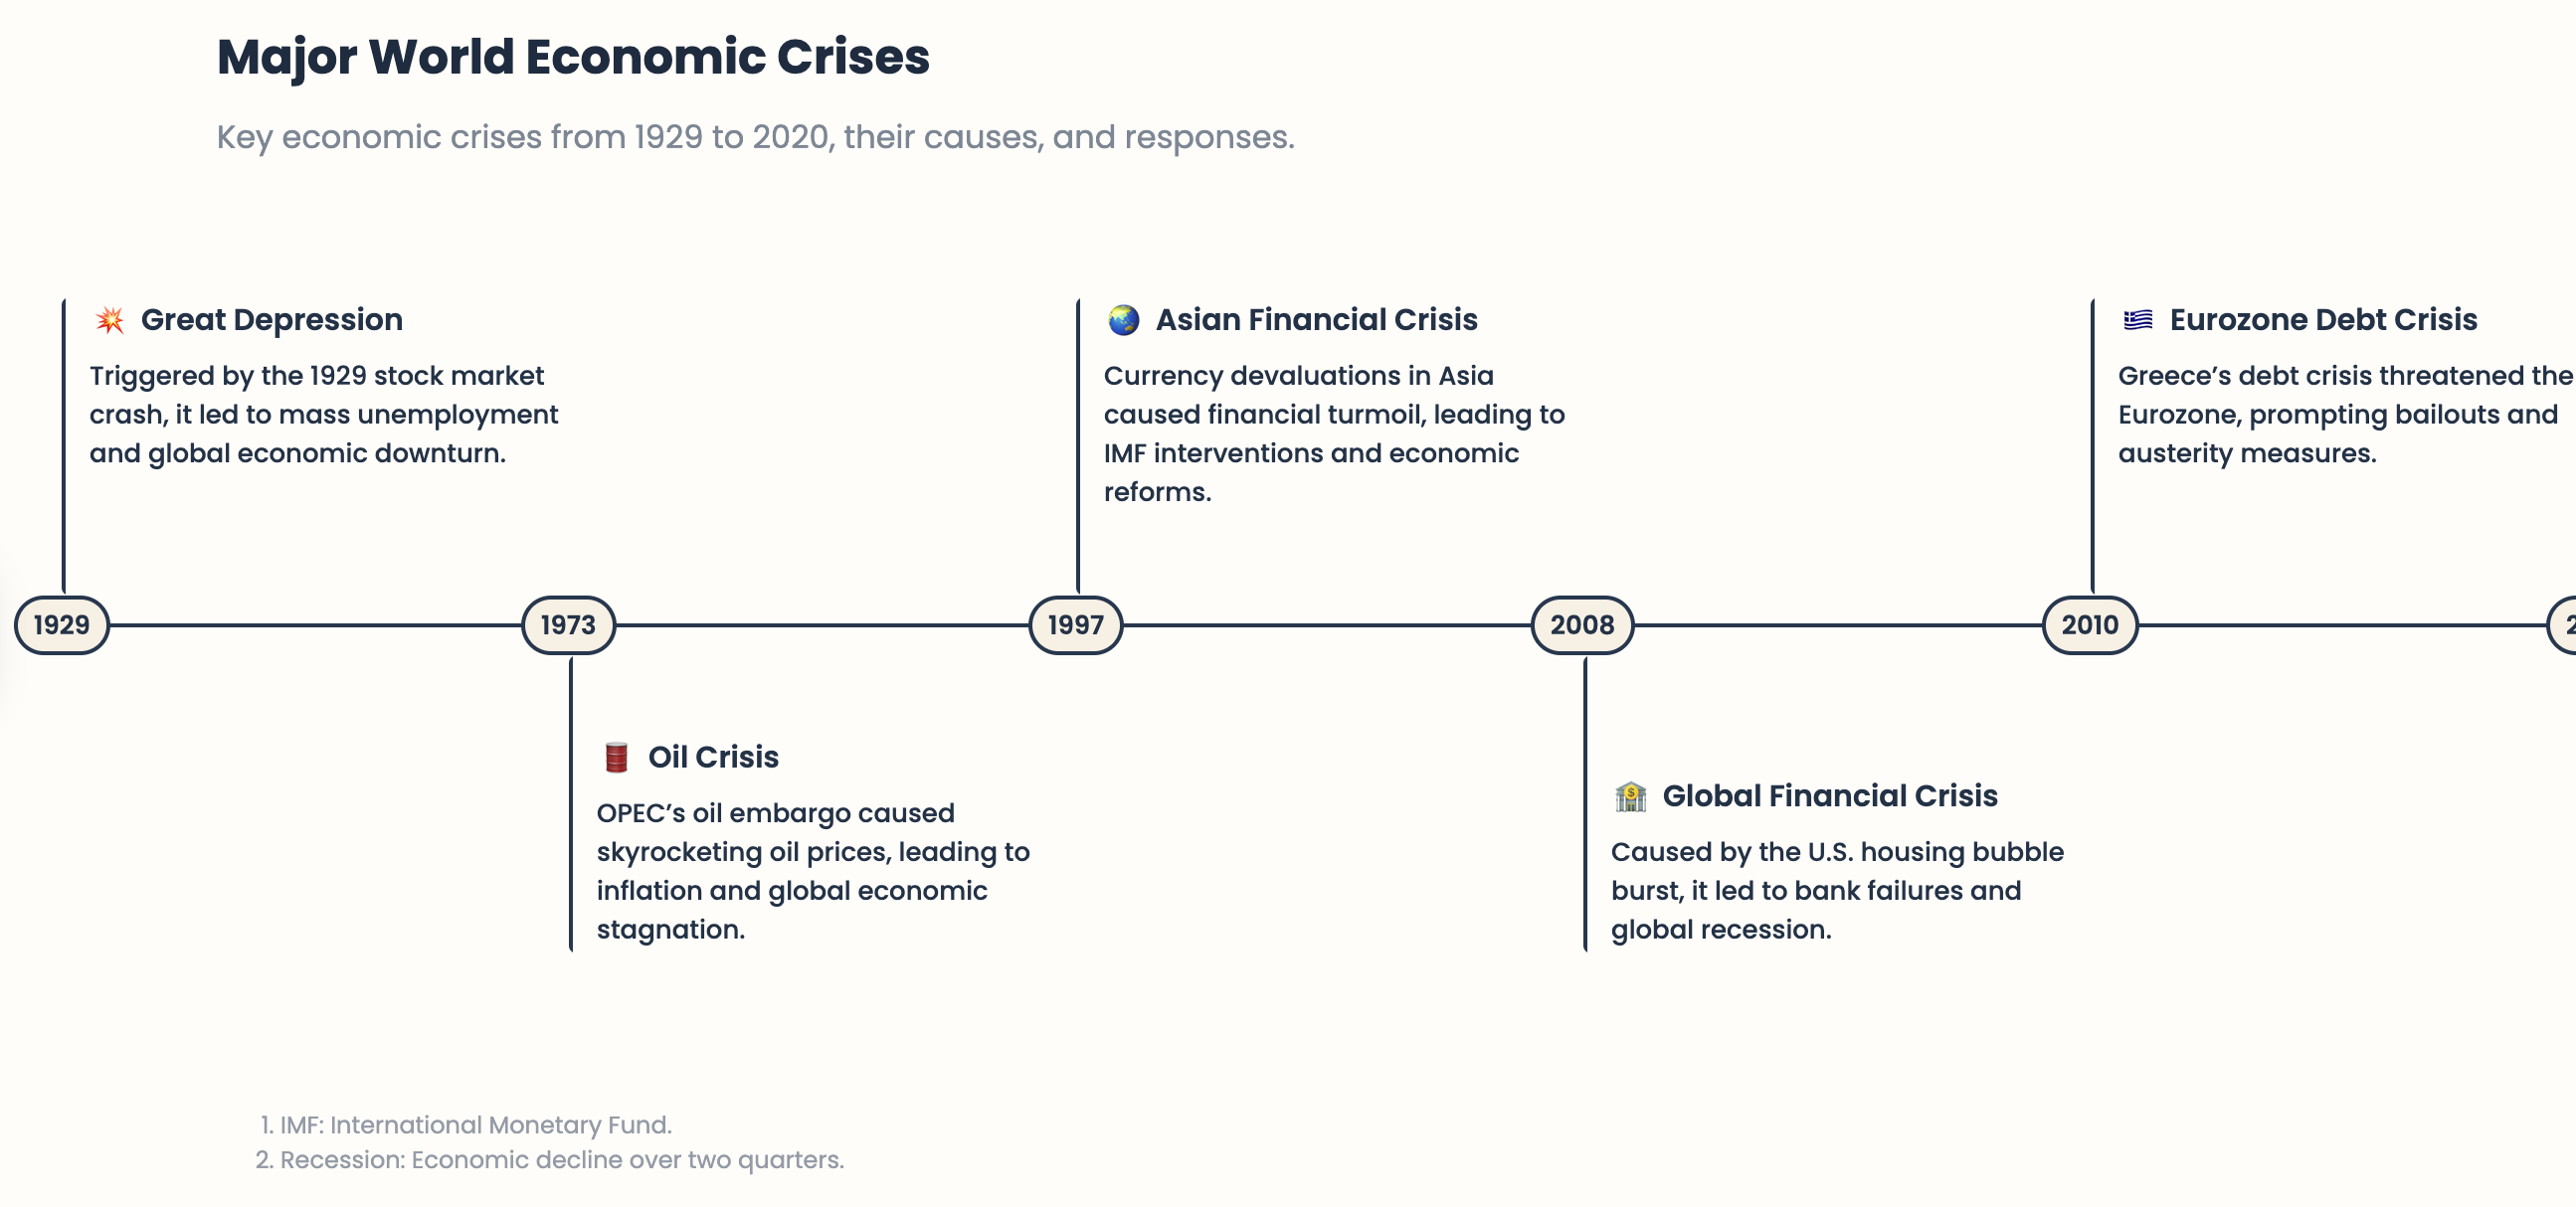
(I show the beginning of the extended timeline.)
As you can see, the timeline app page extracts dates and events and automatically highlights the key milestones, rather than every detail.
You can click on any milestone for more in-depth information. I clicked on “Oil Crisis” and this is what I see:
3) Teach procedures, problem-solving, and method (flowcharts)
Next, I asked MyLens to build a flowchart for choosing a factoring method or solving systems of equations (graphing vs. substitution vs. elimination). Students can annotate each branch with worked examples.
I inputted this YouTube video.
Here is what MyLens created:
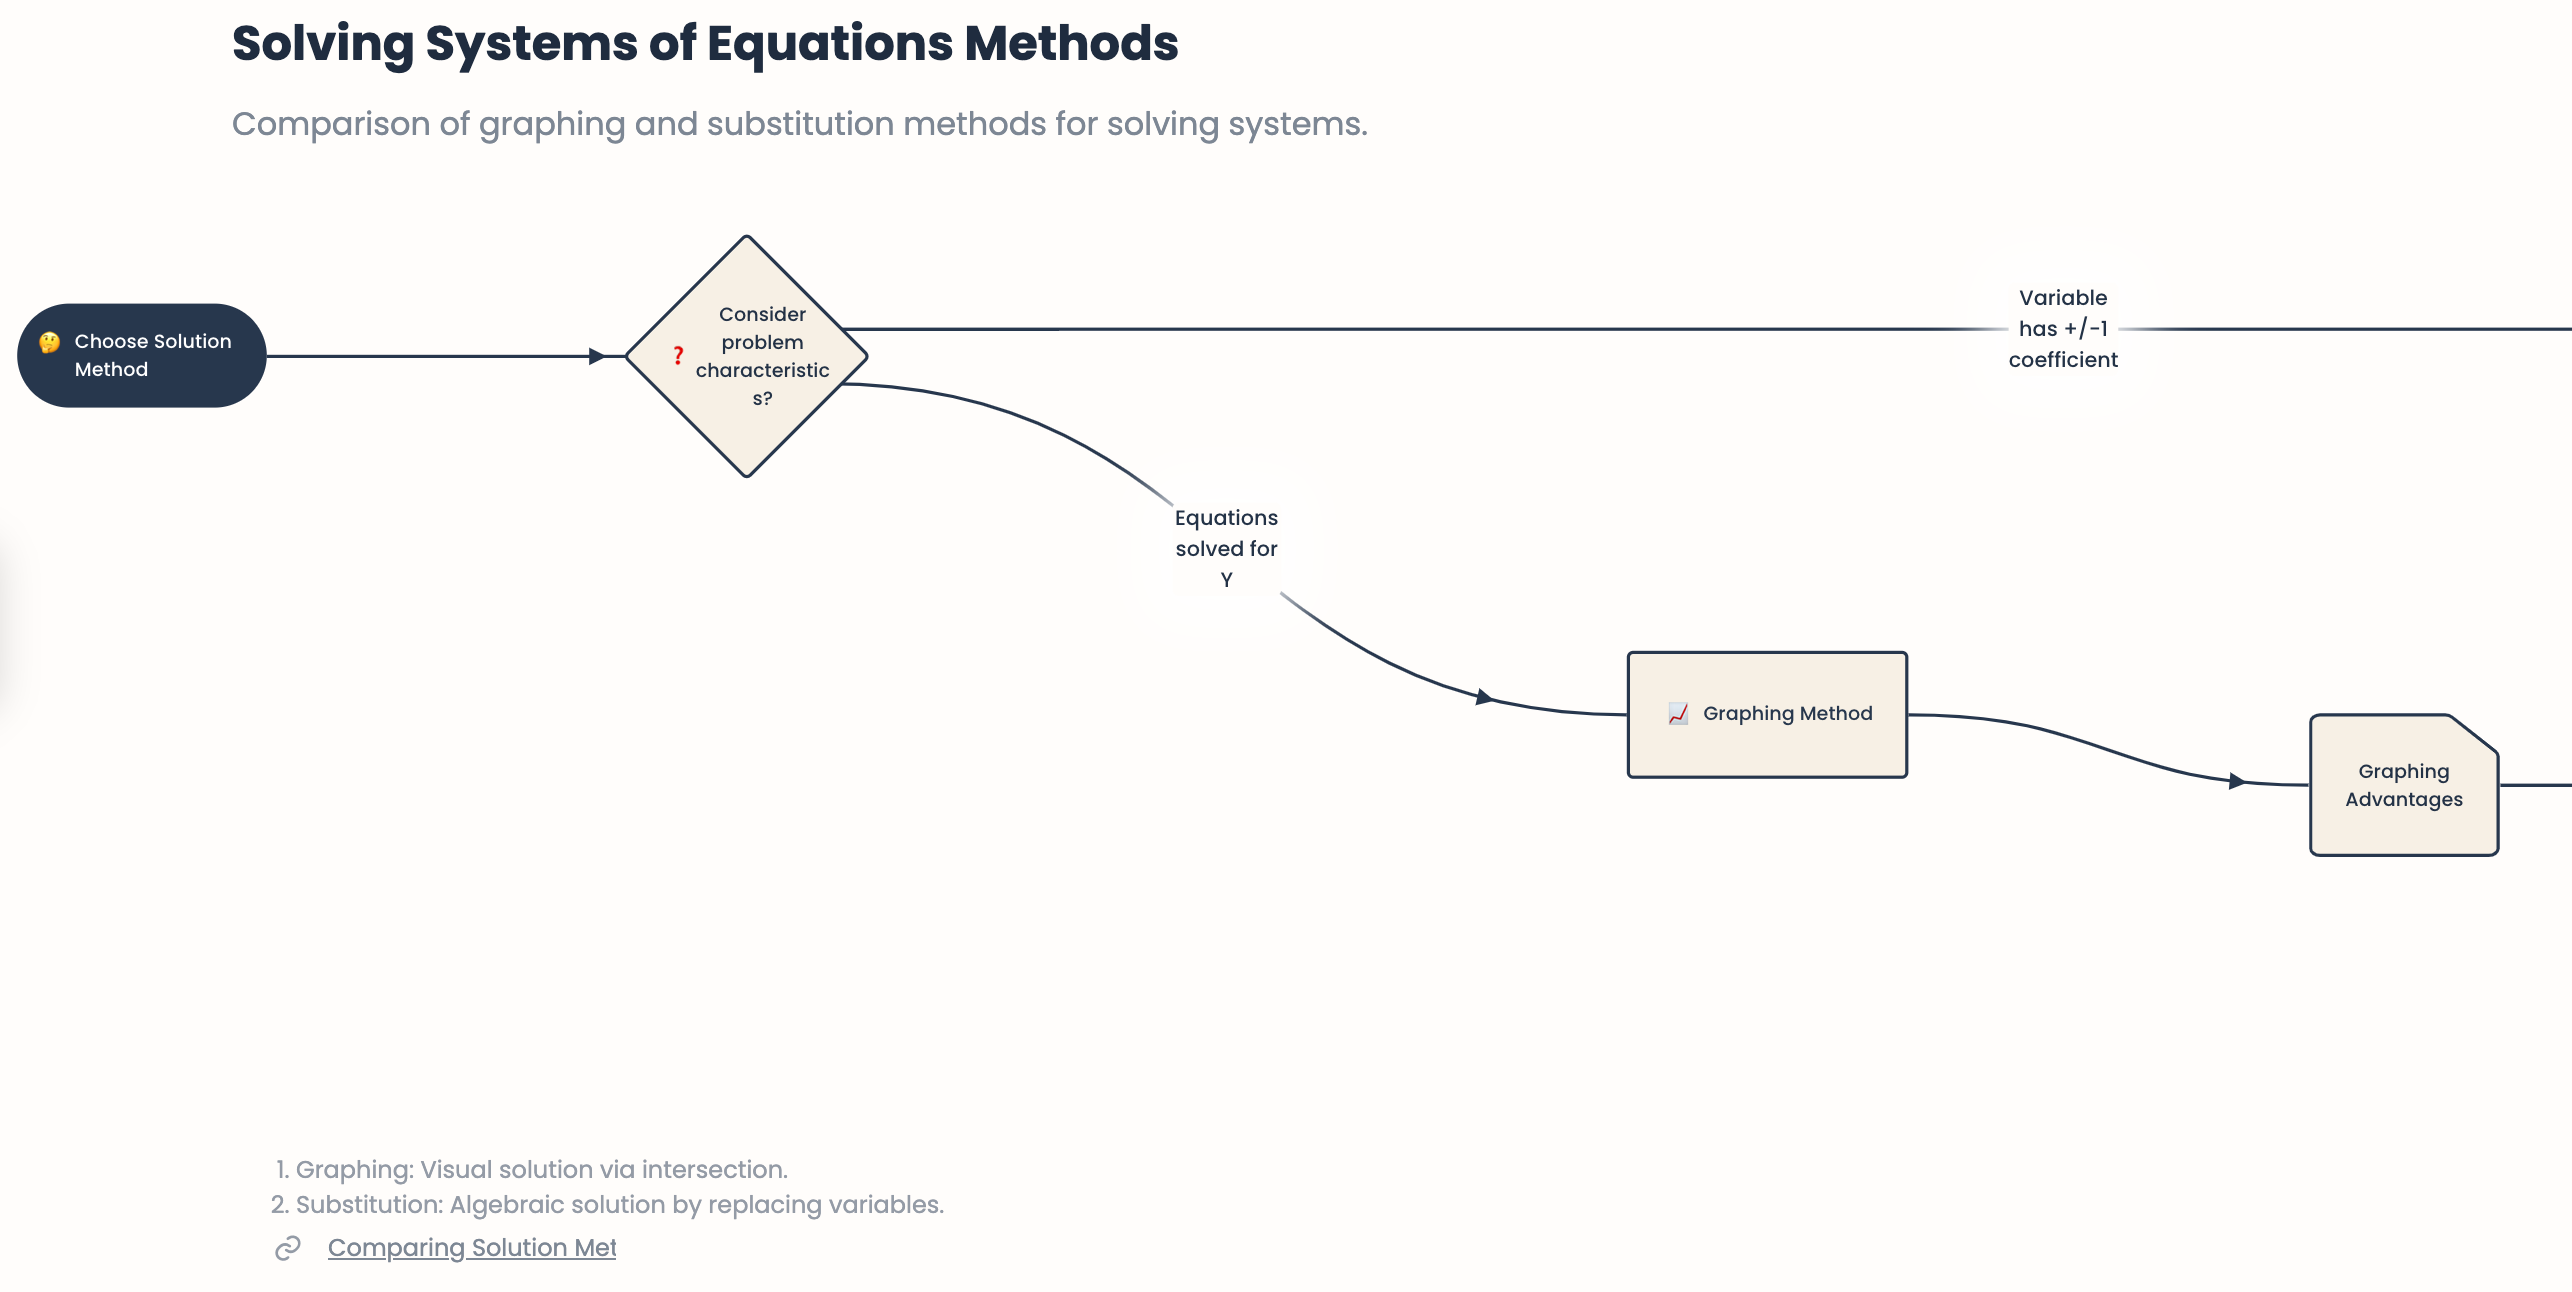
(I show the beginning of the extended flowchart.)
This MyLens visual is designed for use with students. With a Pro plan, teachers could provide an editable flowchart in MyLens. Another option is to export it to a collaborative format (e.g., Google Slides, PDF with text boxes).
4) Build guides and review packets
For this task, I fed MyLens the URL of my AI Tools for Math Teachers webpage, which is packed with information. Here is what it produced:
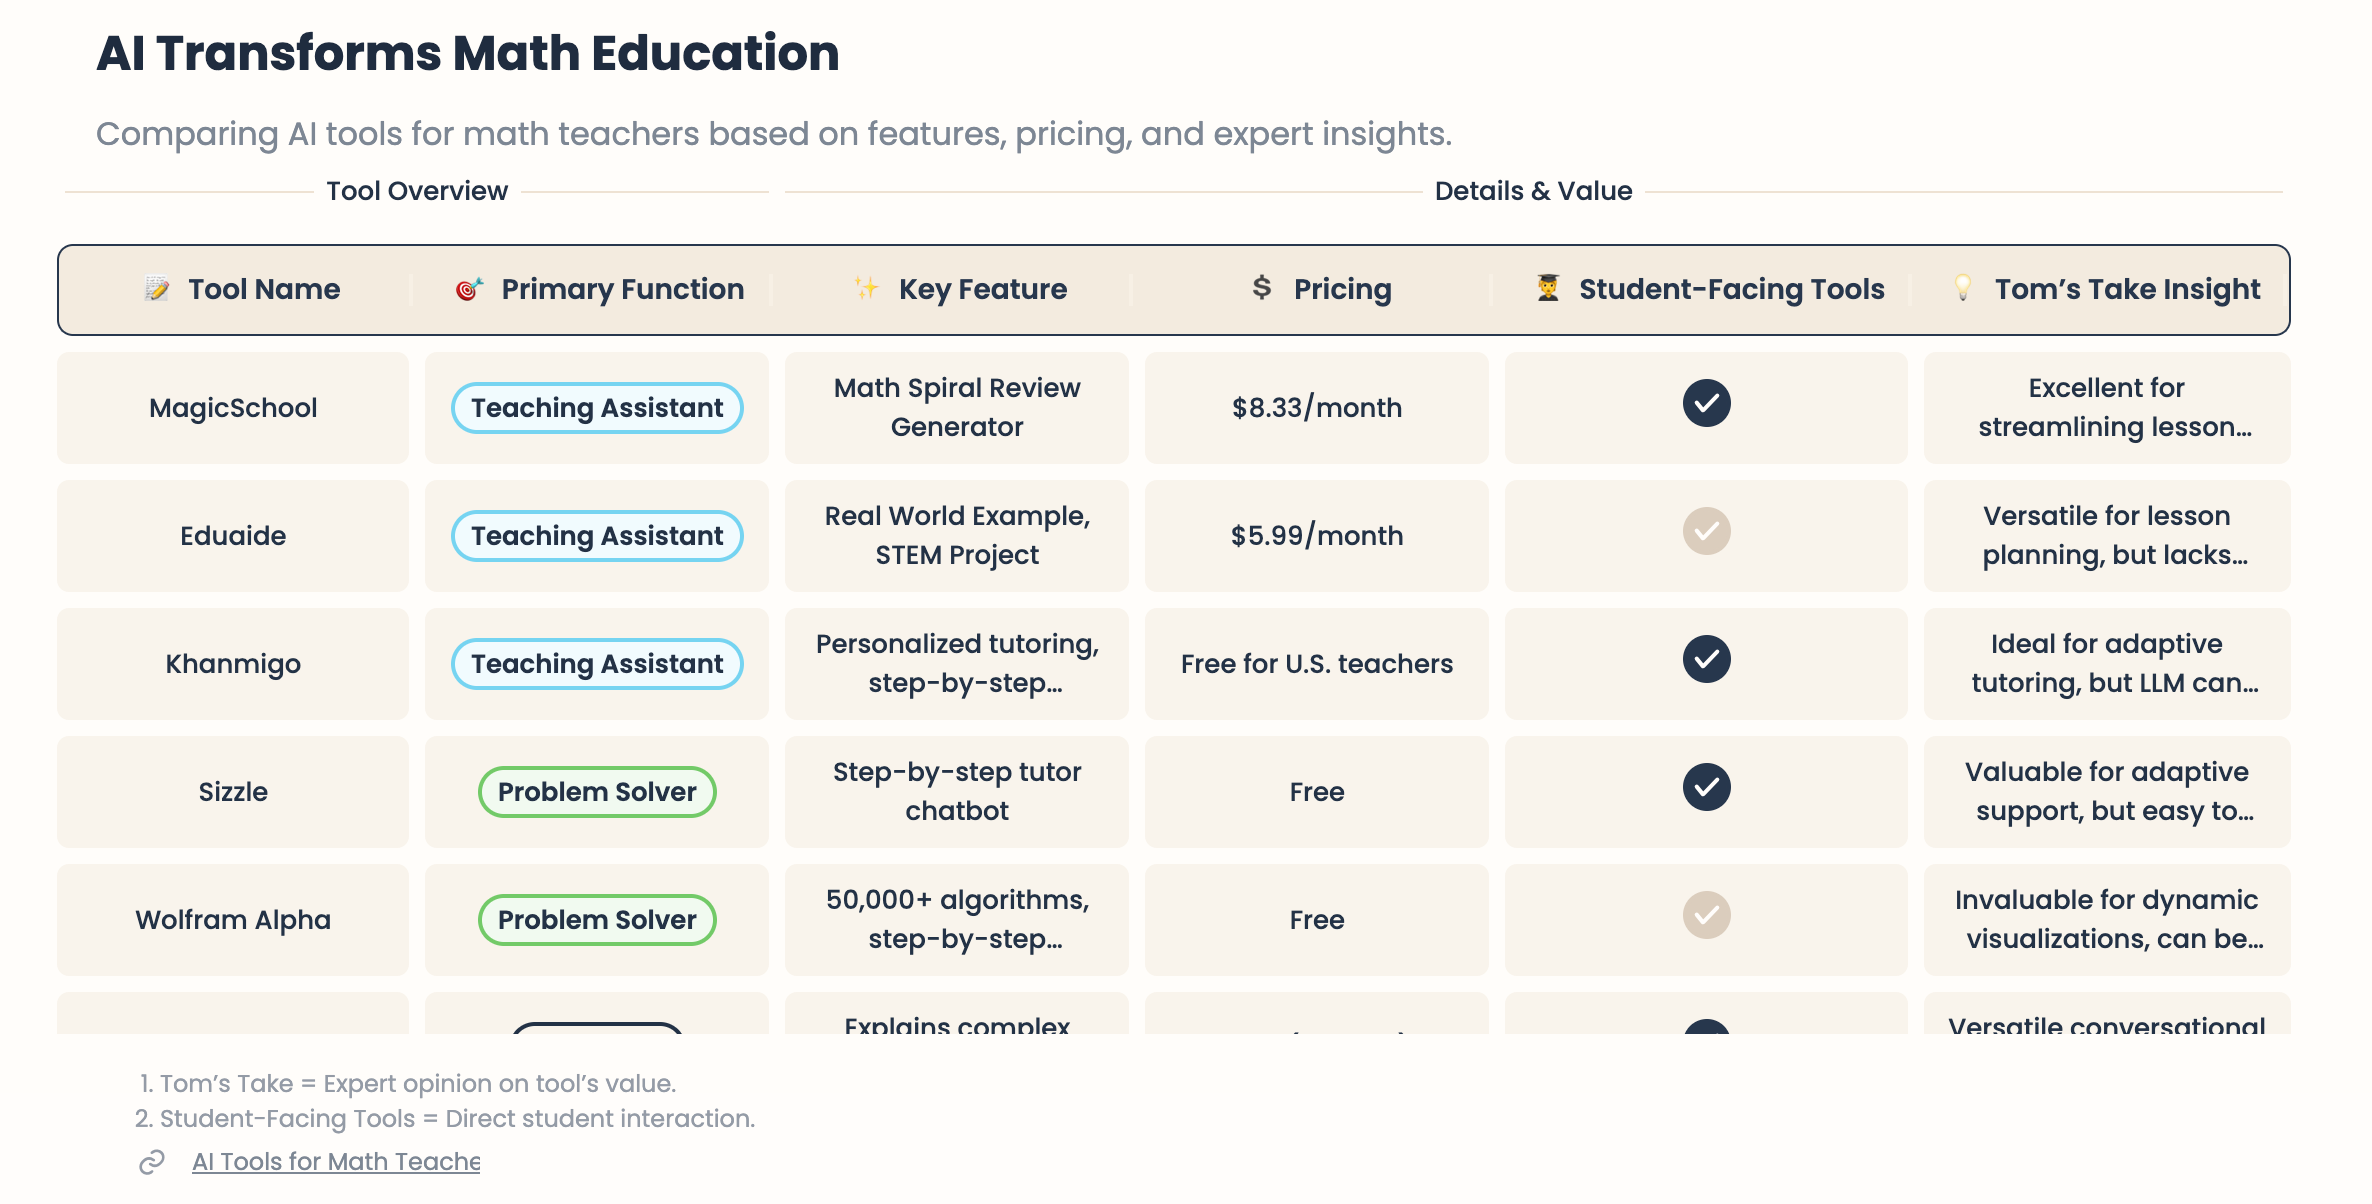
MyLens created a concise and accessible guide to (some) of the tools featured at AI Tools for Math Teachers. It listed 8 tools in total (5 are pictured above), fewer than I would have wanted, but appropriately brief and digestible. I like the design, organization, and color scheme, though I now need to edit some information.
Here are some additional ideas:
5) Create visual summaries (picture board)
For this task, I uploaded a 20-page (3.4 MB) report from the Walton Family on AI use in schools. Here is what it created:
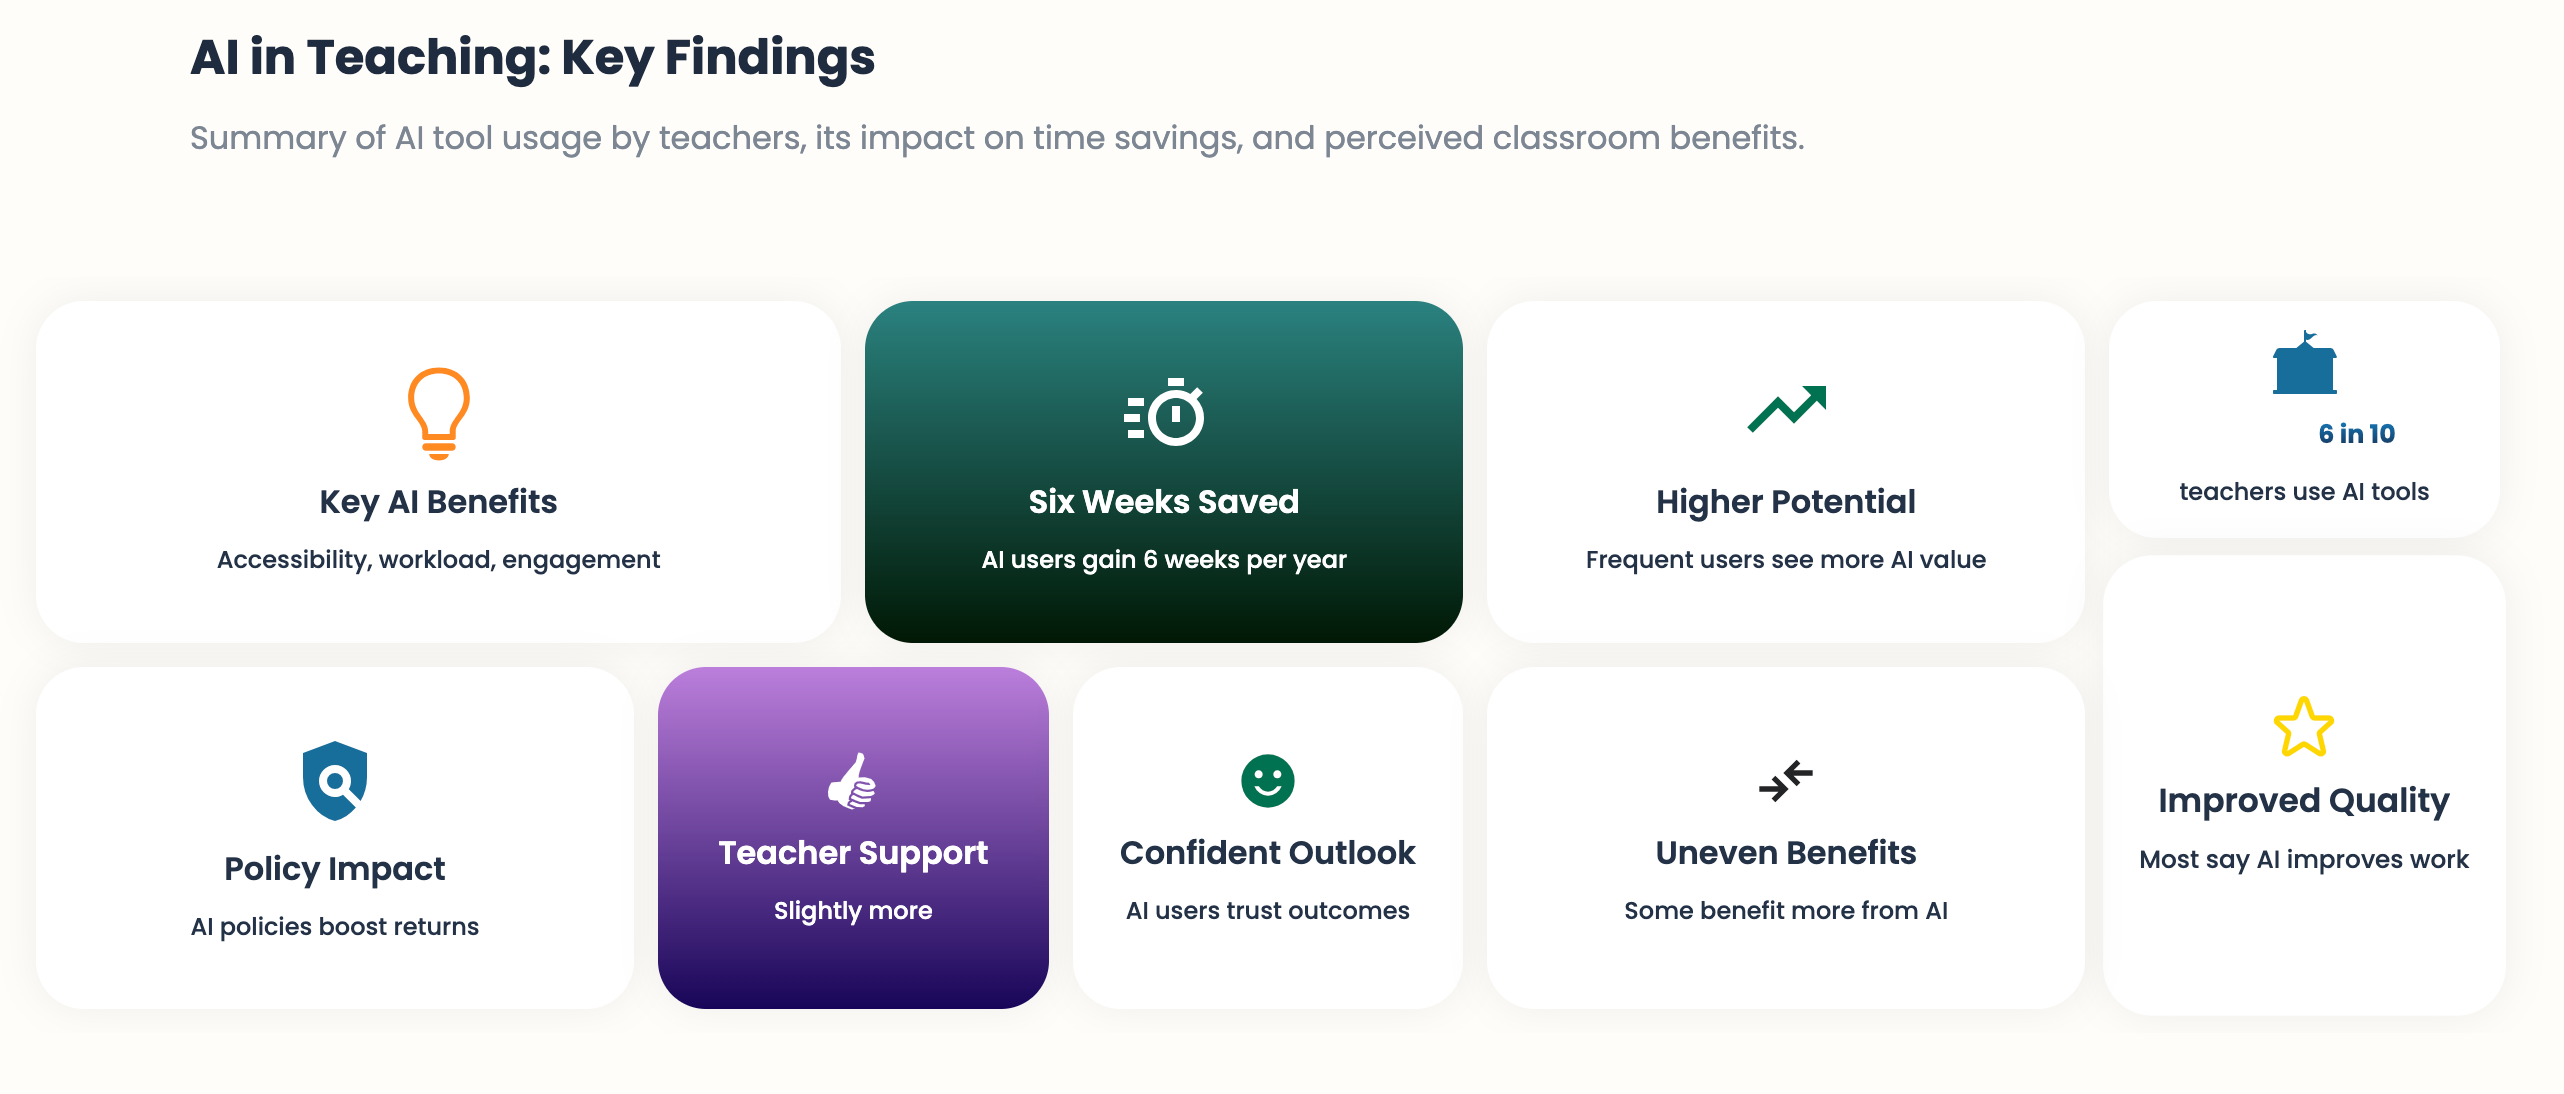
Note that it emphasizes “Six Weeks Saved,” a key theme of the report. I could Drill Down further on any of these sub-topics.
Here are a few more ideas:
6) Differentiate and support multilingual learners
ELL: Turn a short reading into a mind map of tier-two vocabulary grouped by root/affix or theme.
7) Center inquiry and project-based learning
Elementary PBL: Begin with a broad mind map (“How do communities get clean water?”); Use Expand to grow subtopics (water sources, filtration, treatment).
Limitations
I am clearly a fan, but MyLens has its limitations:
It’s AI, so it may make errors. Yet, if you have vetted your input source, than it is less likely to make anything up.
There are free-tier constraints. You can make 3 “stories” a day. That’s probably enough for most teachers, but frustrating when you need more.
Free plan stories are public. You’ll need a paid plan if you want to keep your visuals private.
Free users can only Limited download options
Note: I didn’t find any listed size limit for uploads.
Conclusion
Efficient and simple, MyLens not only helps save you time, but it can help students “see” relationships, sequences, and processes. It handles time-consuming design tasks (that would be cumbersome in Canva), and keeps you in control of visual emphasis and accuracy. For educators, MyLens is a valuable addition to lesson preparation, student comprehension, and for reaching diverse learners.

My new, free 90-page guidebook is now available for download at tomdaccord.com !
Any suggestions to improve this newsletter? Please message me or leave a comment below!